Data-Driven Risk-Adjusted Performance Analysis
A regime-aware empirical comparison between classical risk-adjusted performance ratios and a structural score based on the stability of exponential compounding.
When does a structural price-path measure add information beyond classical risk ratios?
The project compares Sharpe, Sortino, Treynor, Calmar and Information ratios with a complementary score derived from an exponential regression of price. The objective is not to claim a universally superior metric, but to identify the market regimes in which each signal family succeeds or fails.
The proposed score is diff × r × b: diff is the signed distance between the fitted exponential trend and the current price, r measures trend-fit quality in log-price space, and b is the daily log-growth slope.
Compared measures
- Sharpe ratio
- Sortino ratio
- Treynor ratio
- Calmar ratio
- Information ratio
- Exponential-fit score: diff × r × b
Separate the metric from the market regime.
The study evaluates 100 equity ETFs across nine distinct market eras. Five training-window lengths and four test-window lengths produce 180 configurations. Each measure is reduced to a directional signal and evaluated both by directional accuracy and by a long/short portfolio experiment.
The two signal families are almost opposites at regime transitions.
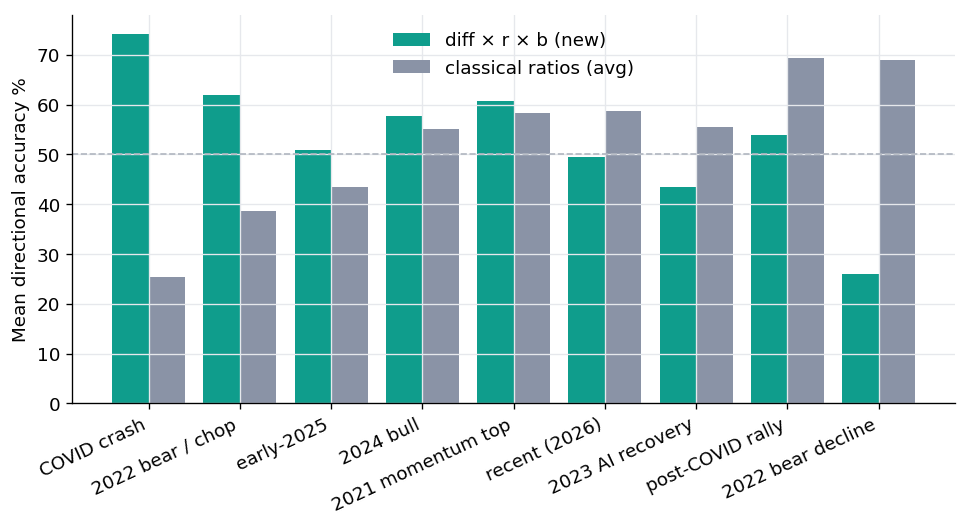
Across nine market eras, neither family leads everywhere. That regime dependence, rather than the superiority of either family, is the main result.
Reversals and choppy markets
The exponential-fit score performs best when prices are stretched away from their recent trend and subsequently revert. In the post-crash rebound case study, directional accuracy reached 96.9% versus a 9.2% average for the five classical ratios.
Persistent trends
The same mean-reversion logic becomes a liability when a trend continues. In the sustained 2022 decline case, the structural score achieved 8.1% accuracy while the classical measures averaged 79.0%.
COVID-crash regime
Across all train/test combinations associated with the crash regime, mean accuracy was 74.2% for the structural score versus 25.5% for the classical average.
2022 choppy bear tape
Across the choppy 2022 regime, the structural score averaged 61.9% versus 38.6% for the classical family.
Two cases, opposite outcomes.
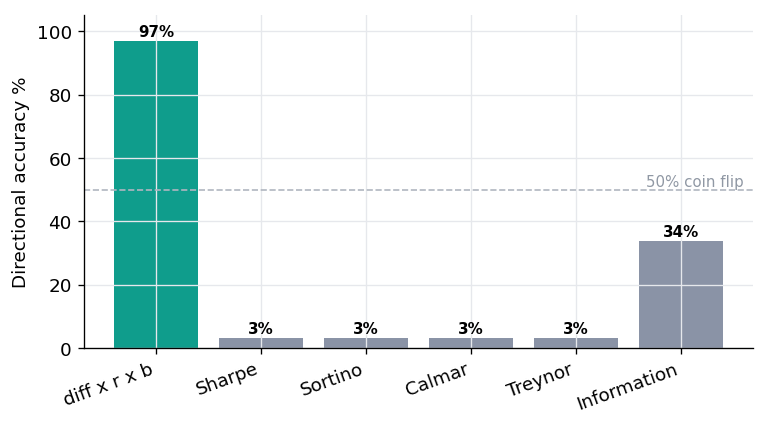
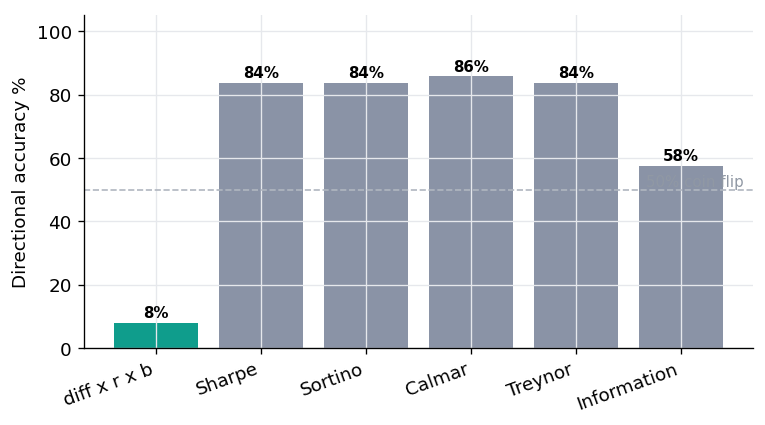
These figures report the directional accuracy of sign-based forecasts in historical test windows. They are research results, not trading performance.
Mean reversion versus momentum, not “new ratio beats old ratios.”
The central insight is interpretive. Classical risk-adjusted ratios are large after strong recent risk-adjusted performance and therefore behave like momentum signals when their sign is used for directional forecasting. The exponential-fit score is positive when price lies below a stable upward trend and negative when price has overshot it, making it a mean-reversion-to-trend signal.
This explains why the two families can appear to “win” in opposite regimes and motivates a regime-aware switching framework rather than a single universal ranking metric.
Next research steps
- Walk-forward sequential backtesting
- Explicit regime classification
- Transaction costs and turnover
- Short-borrow constraints
- Continuous equity-curve evaluation
- Regime-aware signal switching
Final report, source code and live application.
The student final report, the repository and the Streamlit application used in the project.
From final project to conference presentation.
The work continued beyond the capstone and was presented by Dvir Ross at the IEEE ADTM Conference in 2026, as joint work with the supervised students Nehoray Sade and Aviv Asraf of Sami Shamoon College of Engineering.